How To: Run an Irrigation Distribution Uniformity Test
Unexpected blow outs in irrigation pipes and malfunctioning sprinklers are inevitable events that
contribute to inconsistent water output. But, even when a system appears to be running smoothly,
upon a closer look, you may be surprised by the inconsistencies. Variable irrigations build
upon themselves application after application- salts can accumulate, nitrogen can leach, and crops
suffer. Running a simple distribution uniformity (DU) test can reveal how evenly water is actually
being applied, enabling you to weigh the need for making improvements while also informing proper
irrigation sets. Because uniformity has significant impact on yield and water usage, running the
occasional DU test on drip and overhead systems is well worth the time.
Put it to the Test
Using the “Low Quarter Distribution Uniformity Method” for running a DU test is fairly
simple, and can be incorporated into an already scheduled irrigation set.
Overhead System
1. Place catch-cups* throughout a block or field that will be receiving the
same irrigation set. In a grid pattern, place catch cups at regular and even spacing (the more cups
you use, the more data points you’ll have to work with). Using a number divisible by four will
make for cleaner math later on.
2. After the irrigation set, measure and record the volume of water collected in each cup.
3. Map and rank the volumes collected from lowest to highest.
4. Calculate the average volume in the lowest 25% of samples.
5. Divide this number by the average volume of all collected samples. This number is then converted
to your DU percentage.
Drip System
1. Turn on water and wait until the system has pressurized.
2. Place catch-cups at grade level directly under an emitter on the drip line in various locations
throughout the system.
3. Collect water in each catch-cup for a set amount of time.
4. Measure and map out the volume collected in each container.
5. Take the average of the lowest 25% of samples and divide by the overall average.
Example
After running an irrigation set and mapping out the data points:
The average volume in the lowest 25% of samples = 0.75”
The average volume from all samples = 0.9”
0.75” / 0.9” = 0.08333 = 83% distribution uniformity
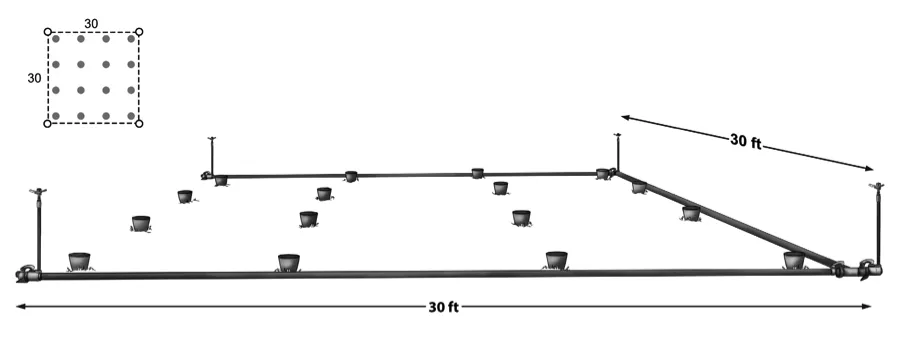
Miguel Mayo, Jose. Sprinkler Uniformity of
Distribution Test. Digital image.Teaching Organic Farming and Gardening. Center for Agroecology and
Sustainable Food Systems, 2015. Web. 10 May 2016.
Interpret the Data
While in theory 100% distribution uniformity is possible, it’s not likely achievable due to various
structural and environmental factors. Therefore, typically, anything that ranks at 80% or or above
is considered acceptable. If your DU rate is less than 80%, the first step is to identify what
factors are contributing to the inconsistencies.
Environmental Factors
While often out of our control, environmental challenges that negatively influence an irrigation
can sometimes be compensated for. For example, on a windy day, you can widen the throw of impact
sprinklers. If slope is something you're dealing with, installing flush
valves at the end of drip tape lines can assist in maintaining equal water distribution
throughout.
Structural Factors
Structural issues are often due to inconsistent and/or older equipment. As system materials age
they become less reliable due to worn out nozzles and gaskets, inevitable leaks, and clogged
emitters. Regularly cleaning filters, flushing lines, and updating emitters are a few ways to
compensate for any variation; reviewing the map a DU test produces can directly point to areas in
your set-up that need improvements. Additionally, it’s also worth investigating the water
pressure to ensure it’s balanced throughout the system.
*Catch-cups can be rain gauges, viles, even mason jars or tin can (as long as you have a way to
measure the water collected in each one).
If you liked this article, and want to see more like it, enter your email in the subscribe box to the top-right of this page and we'll send you new blog articles as we publish them.

Jane works as a Field Production Specialist at the Center for Agroecology and Sustainable
Food Systems, where her days are filled with tractor work, irrigation coordination, orchard
care, and educating apprentices and interns. Her favorite way to end a long day's work in
the sun, is running down the hill to Mitchell's Cove and jumping in the Pacific.